Scientific Computing
NVIDIA Ampere GPU Benchmarks for AMBER 20
April 27, 2022
11 min read

The following Amber 20 Benchmarks were performed on an Exxact AMBER Certified MD System using the following GPUs NVIDIA GeForce RTX 3090, NVIDIA A100 (PCIe), NVIDIA Quadro RTX 6000, NVIDIA GeForce RTX 2080 Ti, NVIDIA RTX A5000, RTX A4000, NVIDIA A10 and RTX A4500 using the AMBER 20 Benchmark Suite.
All benchmarks were performed using a single GPU configuration using Amber 20 Update 6 & AmberTools 20 Update 9. NVIDIA CUDA 11.2 was also used for these benchmarks.
Interested in getting faster results?
Learn more about the only AMBER Certified GPU Systems starting around $6,000
| Make / Model | Supermicro AS -4124GS-TN |
| Nodes | 1 |
| Processor / Count | 2x AMD EPYC 7552 |
| Total Logical Cores | 48 |
| Memory | DDR4 512 GB |
| Storage | NVMe 3.84 TB |
| OS | Centos 7 |
| CUDA Version | 11.2 |
| Amber | 20 |
| Benchmark | RTX A6000 | RTX A5000 | RTX A4500 | RTX A4000 | A100 PCIe | A10 | RTX 3090 | RTX 3080 | RTX 3070 | RTX 2080TI | RTX 6000 |
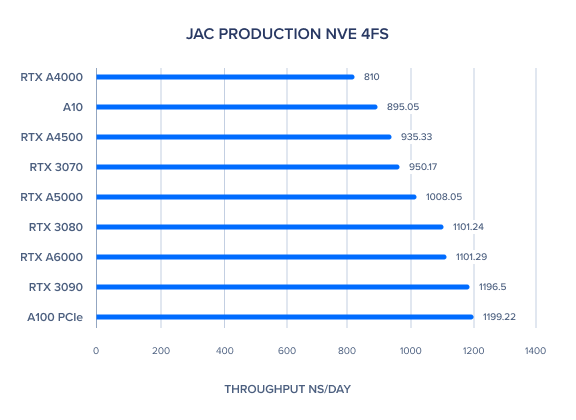
| JAC Production NVE 4fs | 1101.29 | 1008.05 | 935.33 | 810 | 1199.22 | 895.05 | 1196.5 | 1101.24 | 950.17 | 970.51 | 1034.88 |
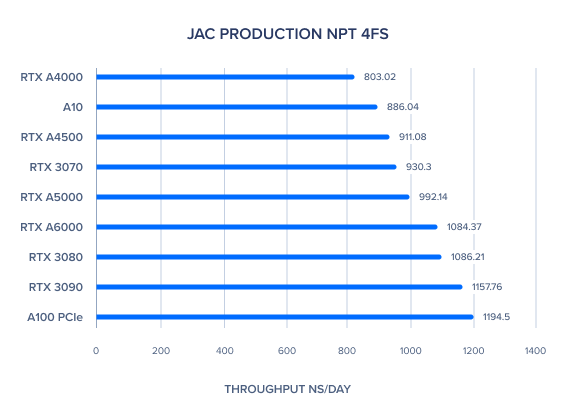
| JAC Production NPT 4fs | 1084.37 | 992.14 | 911.08 | 803.02 | 1194.5 | 886.04 | 1157.76 | 1086.21 | 930.3 | 940.61 | 1004.03 |
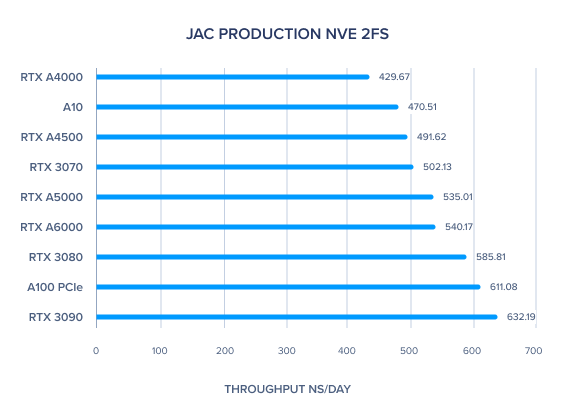
| JAC Production NVE 2fs | 586.09 | 535.01 | 491.62 | 429.67 | 611.08 | 470.51 | 632.19 | 585.81 | 502.13 | 510.21 | 540.17 |
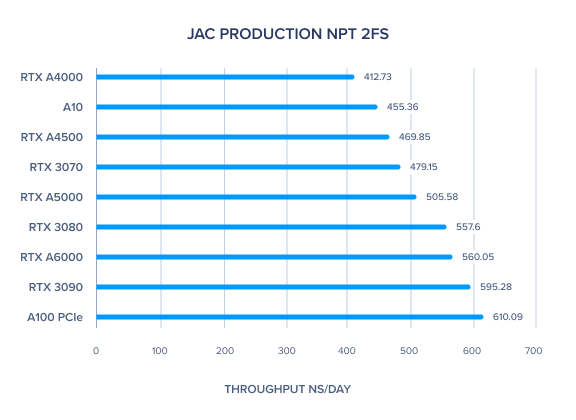
| JAC Production NPT 2fs | 560.05 | 505.58 | 469.85 | 412.73 | 610.09 | 455.36 | 595.28 | 557.6 | 479.15 | 488.36 | 515.86 |
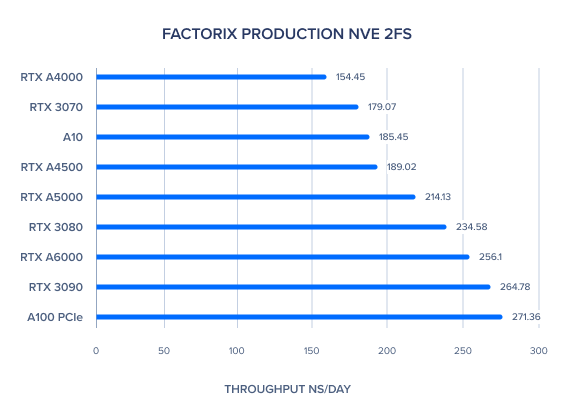
| FactorIX Production NVE 2fs | 256.1 | 214.13 | 189.02 | 154.45 | 271.36 | 185.45 | 264.78 | 234.58 | 179.07 | 205.92 | 217.25 |
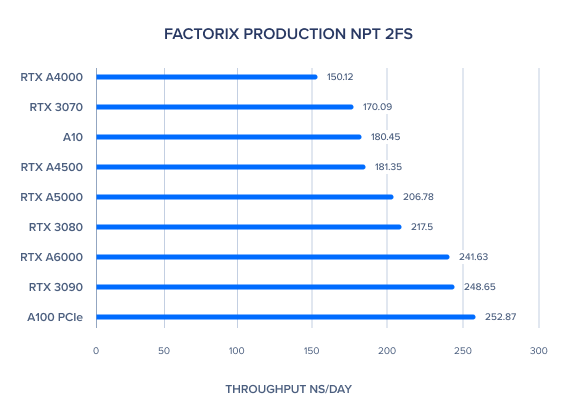
| FactorIX Production NPT 2fs | 241.63 | 206.78 | 181.35 | 150.12 | 252.87 | 180.45 | 248.65 | 217.5 | 170.09 | 189.99 | 206 |
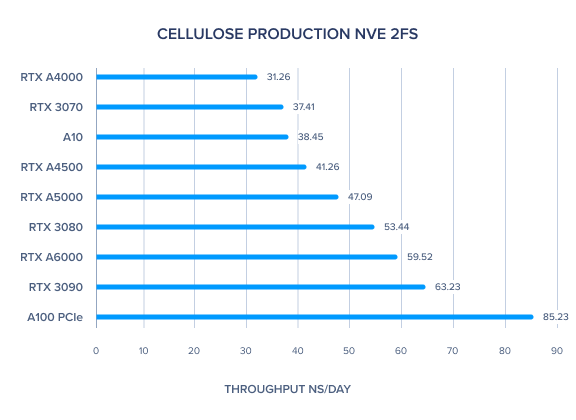
| Cellulose Production NVE 2fs | 59.52 | 47.09 | 41.26 | 31.26 | 85.23 | 38.45 | 63.23 | 53.44 | 37.41 | 43.89 | 47.41 |
| Cellulose Production NPT 2fs | 55.5 | 45.71 | 39.48 | 30.34 | 77.98 | 36.72 | 58.3 | 49.69 | 35.75 | 40.77 | 45.24 |
| STMV Production NPT 4fs | 37.01 | 30.87 | 26.67 | 20.27 | 52.02 | 24.24 | 38.65 | 32.18 | 23.89 | 25.21 | 28.49 |
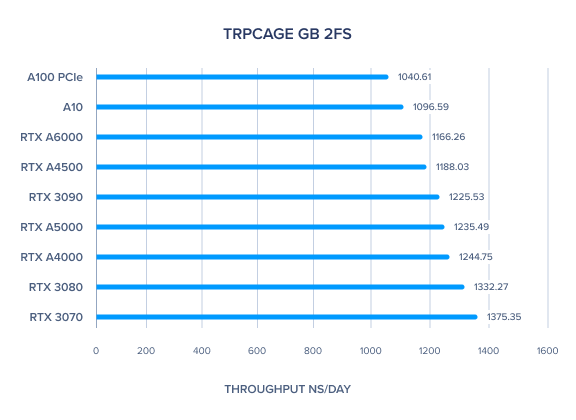
| TRPCage GB 2fs | 1166.26 | 1235.49 | 1188.03 | 1244.75 | 1040.61 | 1096.59 | 1225.53 | 1332.27 | 1375.35 | 1151.74 | 1189.25 |
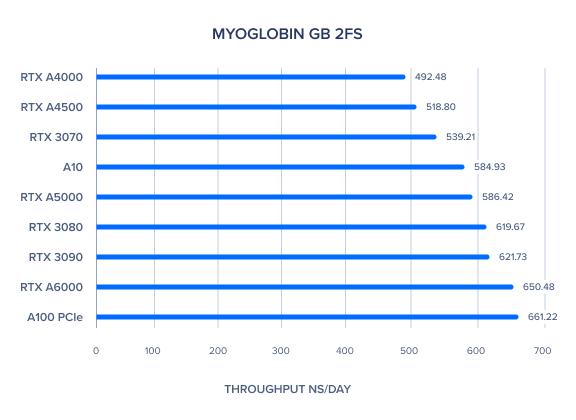
| Myoglobin GB 2fs | 650.48 | 586.42 | 518.8 | 492.48 | 661.22 | 584.93 | 621.73 | 619.67 | 539.21 | 505.93 | 600.83 |
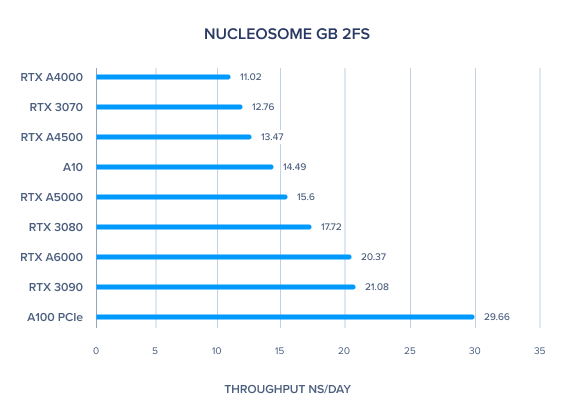
| Nucleosome GB 2fs | 20.37 | 15.6 | 13.47 | 11.02 | 29.66 | 14.49 | 21.08 | 17.72 | 12.76 | 15.22 | 16.81 |
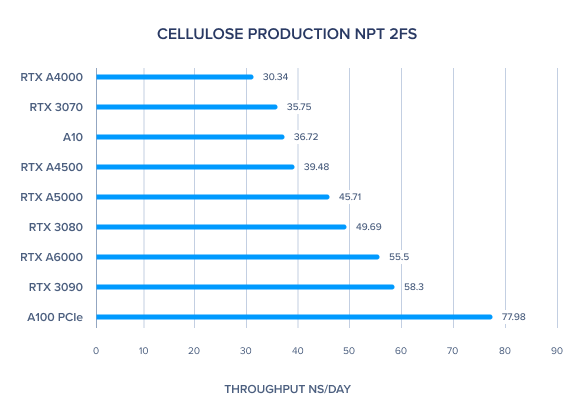
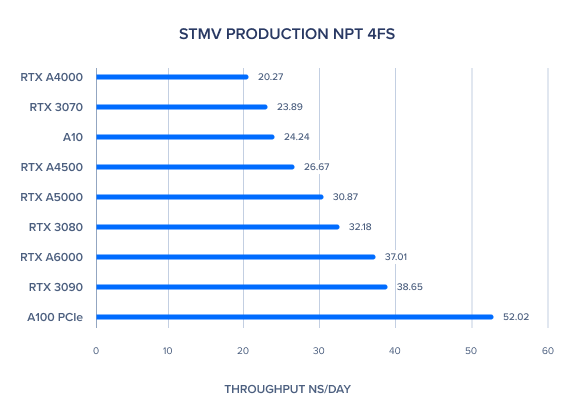
We take as benchmarks four periodic systems spanning a range of system sizes and compositions. The smallest Dihydrofolate Reductase (DHFR) case is a 159-residue protein in water, weighing in at 23,588 atoms. Next, from the human blood clotting system, Factor IX is a 379-residue protein also in a box of water, total 90,906 atoms. The larger cellulose system, 408,609 atoms, has a greater content of macromolecules in it: the repeating sugar polymer constitutes roughly a sixth of the atoms in the system. Finally, the very large simulation of satellite tobacco mosaic virus (STMV), a gargantuan 1,067,095 atom system, also has an appreciable macromolecule content, but is otherwise another collection of proteins in water. (source http://ambermd.org/GPUPerformance.php)
If you’re not familiar with AMBER it refers to ‘Assisted Model Building with Energy Refinement‘, a family of force fields for molecular dynamics of biomolecules originally developed by Peter Kollman’s group at the University of California, San Francisco. AMBER is also the name for the molecular dynamics software package that simulates these force fields, and is maintained by an active collaboration between David Case at Rutgers University, Tom Cheatham at the University of Utah, Adrian Roitberg at University of Florida, Ken Merz at Michigan State University, Carlos Simmerling at Stony Brook University, Ray Luo at UC Irvine, and Junmei Wang at Encysive Pharmaceuticals.
Have any questions?
Contact Exxact Today
The following Amber 20 Benchmarks were performed on an Exxact AMBER Certified MD System using the following GPUs NVIDIA GeForce RTX 3090, NVIDIA A100 (PCIe), NVIDIA Quadro RTX 6000, NVIDIA GeForce RTX 2080 Ti, NVIDIA RTX A5000, RTX A4000, NVIDIA A10 and RTX A4500 using the AMBER 20 Benchmark Suite.
All benchmarks were performed using a single GPU configuration using Amber 20 Update 6 & AmberTools 20 Update 9. NVIDIA CUDA 11.2 was also used for these benchmarks.
Interested in getting faster results?
Learn more about the only AMBER Certified GPU Systems starting around $6,000
| Make / Model | Supermicro AS -4124GS-TN |
| Nodes | 1 |
| Processor / Count | 2x AMD EPYC 7552 |
| Total Logical Cores | 48 |
| Memory | DDR4 512 GB |
| Storage | NVMe 3.84 TB |
| OS | Centos 7 |
| CUDA Version | 11.2 |
| Amber | 20 |
| Benchmark | RTX A6000 | RTX A5000 | RTX A4500 | RTX A4000 | A100 PCIe | A10 | RTX 3090 | RTX 3080 | RTX 3070 | RTX 2080TI | RTX 6000 |
| JAC Production NVE 4fs | 1101.29 | 1008.05 | 935.33 | 810 | 1199.22 | 895.05 | 1196.5 | 1101.24 | 950.17 | 970.51 | 1034.88 |
| JAC Production NPT 4fs | 1084.37 | 992.14 | 911.08 | 803.02 | 1194.5 | 886.04 | 1157.76 | 1086.21 | 930.3 | 940.61 | 1004.03 |
| JAC Production NVE 2fs | 586.09 | 535.01 | 491.62 | 429.67 | 611.08 | 470.51 | 632.19 | 585.81 | 502.13 | 510.21 | 540.17 |
| JAC Production NPT 2fs | 560.05 | 505.58 | 469.85 | 412.73 | 610.09 | 455.36 | 595.28 | 557.6 | 479.15 | 488.36 | 515.86 |
| FactorIX Production NVE 2fs | 256.1 | 214.13 | 189.02 | 154.45 | 271.36 | 185.45 | 264.78 | 234.58 | 179.07 | 205.92 | 217.25 |
| FactorIX Production NPT 2fs | 241.63 | 206.78 | 181.35 | 150.12 | 252.87 | 180.45 | 248.65 | 217.5 | 170.09 | 189.99 | 206 |
| Cellulose Production NVE 2fs | 59.52 | 47.09 | 41.26 | 31.26 | 85.23 | 38.45 | 63.23 | 53.44 | 37.41 | 43.89 | 47.41 |
| Cellulose Production NPT 2fs | 55.5 | 45.71 | 39.48 | 30.34 | 77.98 | 36.72 | 58.3 | 49.69 | 35.75 | 40.77 | 45.24 |
| STMV Production NPT 4fs | 37.01 | 30.87 | 26.67 | 20.27 | 52.02 | 24.24 | 38.65 | 32.18 | 23.89 | 25.21 | 28.49 |
| TRPCage GB 2fs | 1166.26 | 1235.49 | 1188.03 | 1244.75 | 1040.61 | 1096.59 | 1225.53 | 1332.27 | 1375.35 | 1151.74 | 1189.25 |
| Myoglobin GB 2fs | 650.48 | 586.42 | 518.8 | 492.48 | 661.22 | 584.93 | 621.73 | 619.67 | 539.21 | 505.93 | 600.83 |
| Nucleosome GB 2fs | 20.37 | 15.6 | 13.47 | 11.02 | 29.66 | 14.49 | 21.08 | 17.72 | 12.76 | 15.22 | 16.81 |
We take as benchmarks four periodic systems spanning a range of system sizes and compositions. The smallest Dihydrofolate Reductase (DHFR) case is a 159-residue protein in water, weighing in at 23,588 atoms. Next, from the human blood clotting system, Factor IX is a 379-residue protein also in a box of water, total 90,906 atoms. The larger cellulose system, 408,609 atoms, has a greater content of macromolecules in it: the repeating sugar polymer constitutes roughly a sixth of the atoms in the system. Finally, the very large simulation of satellite tobacco mosaic virus (STMV), a gargantuan 1,067,095 atom system, also has an appreciable macromolecule content, but is otherwise another collection of proteins in water. (source http://ambermd.org/GPUPerformance.php)
If you’re not familiar with AMBER it refers to ‘Assisted Model Building with Energy Refinement‘, a family of force fields for molecular dynamics of biomolecules originally developed by Peter Kollman’s group at the University of California, San Francisco. AMBER is also the name for the molecular dynamics software package that simulates these force fields, and is maintained by an active collaboration between David Case at Rutgers University, Tom Cheatham at the University of Utah, Adrian Roitberg at University of Florida, Ken Merz at Michigan State University, Carlos Simmerling at Stony Brook University, Ray Luo at UC Irvine, and Junmei Wang at Encysive Pharmaceuticals.
Have any questions?
Contact Exxact Today
