Artificial Intelligence
The 6 Metrics You Need to Optimize for Performance in Machine Learning
November 5, 2019
6 min read


There are many metrics to measure the performance of your model depending on the type of machine learning you are looking to conduct. In this article, we take a look at performance measures for classification and regression models and discuss which is better optimized. Sometimes the metric to look at will vary according to the problem that is initially being solved.
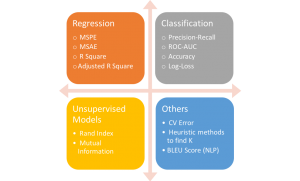
Examples of metrics in Machine Learning
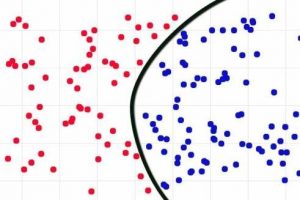
Example of a classification chart
The True Positive Rate also called Recall is the go-to performance measure in binary/non-binary classification problems. Most if not all the time, we are only interested in correctly predicting one class. For example, if you were predicting diabetes, you will care more about predicting whether this person has diabetes than predicting this person does not have diabetes. In this situation, the positive class is ‘this person has diabetes’ and the negative class is ‘this person does not have diabetes’. It is merely the accuracy of predicting the positive class (This is not the Accuracy performance metric. See number 4 below for more detail)
A ROC Curve shows the performance of your classification model at different thresholds (probability of classification into a certain class). It plots the True Positive Rate and False Positive Rate against each other. Lowering the threshold will increase your True Positive Rate but sacrifice your False Positive Rate and vice versa.

AUC is also known as ‘Area Under the ROC Curve’. Simply put the AUC will tell you the probability of correctly classifying your classes. A higher AUC represents a better model.
Accuracy is by default the first thing to look at. However, a real Data Scientist knows that Accuracy is too misleading. A better way to call it is the Average Accuracy of predicting all classes. Like I mentioned with True Positive Rate, it is the most ideal metric to optimize. Accuracy will take the average of the sum of True Positive and True Negative. Most times in unbalanced classification problems, the Negative class is more represented than the Positive class so you are more likely to have a very high True Negative Rate. The Accuracy will then be biased to the accurate predictions of the Negative class which might not interest anyone.

Example of a regression chart
Often overlooked next to R2, the error tells us more about the precision of the fitted values to the regression line (i.e. the average distance between the fitted values and the line of best fit). This is more important when calculating confidence and prediction intervals for your model. It is more interpretable due to the use of the natural units of the response variable whereas the R2 has no units and is only between 0 and 1.
There are different types of errors such as ‘Mean Absolute Error’ and ‘Root Mean Squared Error.’ Each has its own pros and cons and must be treated independently to assess a model.
Now although Standard Error is important, the R2 has become the de-facto measure of a good regression model. It tells us how much the variation between the dependent variable and the independent variables is explained by the model. A higher R2 gives a better model, however, if too high at close to 99% can sometimes cause the risk of overfitting. R2 can be misleading due to the correlation vs causation debate that can give an illogically high R2 .
Accuracy is not always the best measure in a classification problem and R2 might not be the best for regression. They are both definitely the easiest to understand especially by non-technical stakeholders (which is probably the biggest reason for building a model in the first place). The best possible approach may be to consider a variety of performance metrics and consider your initial objective. The performance of a model is always subject to the objective of the user. A poor performance from one person’s point of view might not be the case for another.

There are many metrics to measure the performance of your model depending on the type of machine learning you are looking to conduct. In this article, we take a look at performance measures for classification and regression models and discuss which is better optimized. Sometimes the metric to look at will vary according to the problem that is initially being solved.
Examples of metrics in Machine Learning
Example of a classification chart
The True Positive Rate also called Recall is the go-to performance measure in binary/non-binary classification problems. Most if not all the time, we are only interested in correctly predicting one class. For example, if you were predicting diabetes, you will care more about predicting whether this person has diabetes than predicting this person does not have diabetes. In this situation, the positive class is ‘this person has diabetes’ and the negative class is ‘this person does not have diabetes’. It is merely the accuracy of predicting the positive class (This is not the Accuracy performance metric. See number 4 below for more detail)
A ROC Curve shows the performance of your classification model at different thresholds (probability of classification into a certain class). It plots the True Positive Rate and False Positive Rate against each other. Lowering the threshold will increase your True Positive Rate but sacrifice your False Positive Rate and vice versa.
AUC is also known as ‘Area Under the ROC Curve’. Simply put the AUC will tell you the probability of correctly classifying your classes. A higher AUC represents a better model.
Accuracy is by default the first thing to look at. However, a real Data Scientist knows that Accuracy is too misleading. A better way to call it is the Average Accuracy of predicting all classes. Like I mentioned with True Positive Rate, it is the most ideal metric to optimize. Accuracy will take the average of the sum of True Positive and True Negative. Most times in unbalanced classification problems, the Negative class is more represented than the Positive class so you are more likely to have a very high True Negative Rate. The Accuracy will then be biased to the accurate predictions of the Negative class which might not interest anyone.
Example of a regression chart
Often overlooked next to R2, the error tells us more about the precision of the fitted values to the regression line (i.e. the average distance between the fitted values and the line of best fit). This is more important when calculating confidence and prediction intervals for your model. It is more interpretable due to the use of the natural units of the response variable whereas the R2 has no units and is only between 0 and 1.
There are different types of errors such as ‘Mean Absolute Error’ and ‘Root Mean Squared Error.’ Each has its own pros and cons and must be treated independently to assess a model.
Now although Standard Error is important, the R2 has become the de-facto measure of a good regression model. It tells us how much the variation between the dependent variable and the independent variables is explained by the model. A higher R2 gives a better model, however, if too high at close to 99% can sometimes cause the risk of overfitting. R2 can be misleading due to the correlation vs causation debate that can give an illogically high R2 .
Accuracy is not always the best measure in a classification problem and R2 might not be the best for regression. They are both definitely the easiest to understand especially by non-technical stakeholders (which is probably the biggest reason for building a model in the first place). The best possible approach may be to consider a variety of performance metrics and consider your initial objective. The performance of a model is always subject to the objective of the user. A poor performance from one person’s point of view might not be the case for another.
